SYNTHETIC SERVICE INTELLIGENCE / 19 REPORT TYPES
From service events
to a fuller business view.
1,000 fictional cases. 20 equipment types. 40 assets. Three service regions.
Evaluation assumptions only. Period: 1 January-14 October 2026. Snapshot: 15 October 2026, 00:00 KSA. No real customers, engineers, patient records or clinical results.
Download detailed report PDFDownload app datasetDownload case guideReport library
- Executive service overview
- Financial performance and direct contribution
- Regional service coverage
- Customer portfolio review
- Engineer activity and workload
- Equipment availability, downtime and intervals
- Response and SLA compliance
- Closure plans and backlog aging
- Repair-center turnaround and 14-day review
- Delivery lead time and promise adherence
- Preventive maintenance and due register
- Installation, commissioning and sales support
- Warranty and coverage economics
- Contract coverage and renewal exposure
- Stock availability, valuation and reorder review
- Stock movement and work-order cost reconciliation
- Price-list versions and quote variance
- Recurring service and technical evidence
- Data quality, test coverage and release gaps
REPORT 01
Executive service overview
A portfolio view of service demand, completion, reliability and recorded economics.
| Dimension | Synthetic portfolio |
|---|---|
| Equipment | 40 assets / 20 generic types |
| Organizations / regions | 10 fictional hospitals / Central, Western, Eastern |
| Engineers | 5 numbered engineers |
| Scenario families | 25 families, 40 asset variants each |
| Reporting cutoff | 15 October 2026 00:00 KSA; January 1-October 14 inclusive |
Calculation basis: Job counts cover all cases. Availability uses only 36 assets with confirmed complete observation logs.
Management action: Review aged backlog, missed delivery promises and recurring symptoms before expanding capacity.
Interpretation limits: Fictional assumptions demonstrate software behavior; they are not customer performance evidence.
REPORT 02
Financial performance and direct contribution
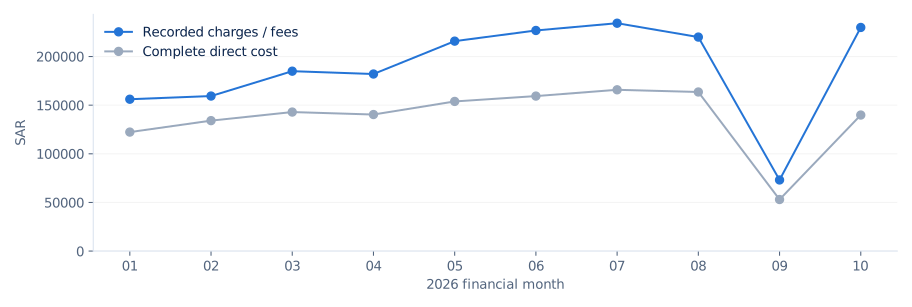
Connect entered customer charges with the full known direct service cost.
| Month | Dated orders | Revenue SAR | Direct cost SAR | Matched |
|---|---|---|---|---|
| 2026-01 | 81 | 156,113.75 | 122,335.00 | 76 |
| 2026-02 | 90 | 159,375.00 | 134,107.50 | 85 |
| 2026-03 | 102 | 184,940.00 | 142,922.50 | 96 |
| 2026-04 | 97 | 182,027.50 | 140,373.75 | 93 |
| 2026-05 | 102 | 215,820.00 | 153,842.50 | 99 |
| 2026-06 | 99 | 226,790.00 | 159,342.50 | 95 |
| 2026-07 | 99 | 234,255.00 | 165,802.50 | 93 |
| 2026-08 | 100 | 220,001.25 | 163,552.50 | 94 |
| 2026-09 | 29 | 73,113.75 | 53,010.00 | 28 |
| 2026-10 | 81 | 229,893.75 | 139,852.50 | 81 |
Calculation basis: Financial record date controls inclusion. Itemized labor, parts and other charges replace base revenue; installation and entered warranty fees are added. Cost includes all five activity categories plus parts, travel expenses and other costs.
Management action: Investigate negative-contribution cases by coverage, distance and parts usage before changing rates.
Interpretation limits: Direct contribution excludes overhead, tax, depreciation, bad debt and accounting recognition. It is not net profit, invoiced revenue, receivables or cash collected.
REPORT 03
Regional service coverage
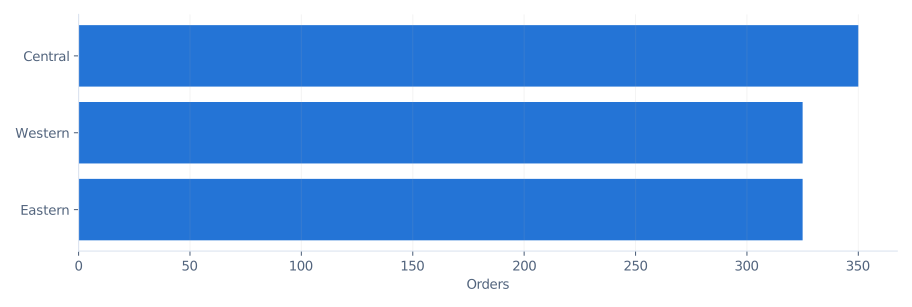
Compare volumes, speed and contribution across the three configured coverage areas.
| Region | Orders | Open | Response h | SLA % | Contribution SAR |
|---|---|---|---|---|---|
| Central | 350 | 42 | 2.3 | 92.0 | 168,971.25 |
| Western | 325 | 39 | 2.3 | 92.0 | 159,532.50 |
| Eastern | 325 | 39 | 2.3 | 92.0 | 178,685.00 |
Calculation basis: Financial values use complete dated records. Regional availability is calculated separately by asset observation.
Management action: Review regional travel, stock positions and backlog together when planning field coverage.
Interpretation limits: No staffing capacity, geography optimization or travel-distance feed is available. Regional counts are case-mix assumptions, not market demand.
REPORT 04
Customer portfolio review
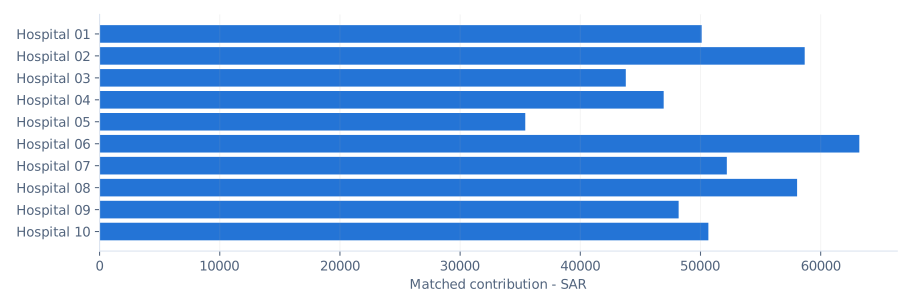
Examine service load and commercial exposure for each fictional hospital.
| Hospital | Orders | Open | Revenue SAR | Direct cost SAR | Contribution SAR |
|---|---|---|---|---|---|
| Hospital 01 | 100 | 12 | 149,785.00 | 99,687.50 | 50,097.50 |
| Hospital 02 | 100 | 12 | 165,215.00 | 106,545.00 | 58,670.00 |
| Hospital 03 | 100 | 12 | 171,295.00 | 127,510.00 | 43,785.00 |
| Hospital 04 | 100 | 12 | 193,592.50 | 146,656.25 | 46,936.25 |
| Hospital 05 | 100 | 12 | 188,570.00 | 153,150.00 | 35,420.00 |
| Hospital 06 | 100 | 12 | 186,757.50 | 123,542.50 | 63,215.00 |
| Hospital 07 | 100 | 12 | 193,380.00 | 141,188.75 | 52,191.25 |
| Hospital 08 | 100 | 12 | 206,297.50 | 148,260.00 | 58,037.50 |
| Hospital 09 | 100 | 12 | 202,920.00 | 154,738.75 | 48,181.25 |
| Hospital 10 | 100 | 12 | 224,517.50 | 173,862.50 | 50,655.00 |
Calculation basis: Costs and charges are aggregated by the work-order customer label. Contract annual values are not added to job revenue.
Management action: Use the review to select accounts for a joint service-plan and coverage discussion.
Interpretation limits: No satisfaction survey, complaints resolution score, customer acceptance or verified contract profitability is present.
REPORT 05
Engineer activity and workload
Make field work and supporting effort visible without treating all hours as billable.
| Engineer | Orders | Open | Recorded h | Response h | SLA % |
|---|---|---|---|---|---|
| Engineer 01 | 200 | 24 | 920.2 | 2.3 | 92.0 |
| Engineer 02 | 200 | 24 | 931.0 | 2.3 | 92.0 |
| Engineer 03 | 200 | 24 | 931.8 | 2.2 | 92.0 |
| Engineer 04 | 200 | 24 | 937.5 | 2.3 | 92.0 |
| Engineer 05 | 200 | 24 | 942.5 | 2.3 | 92.0 |
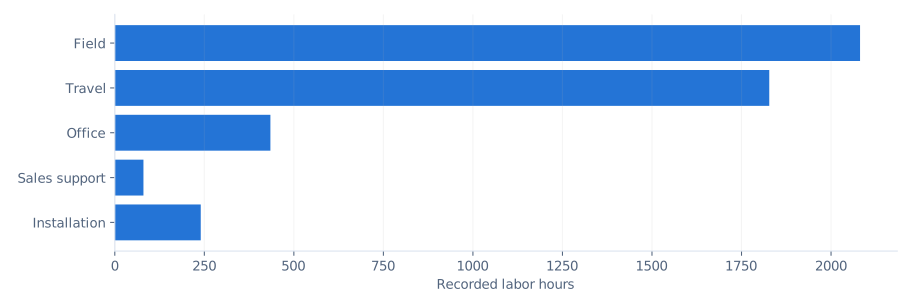
Calculation basis: Known field, travel, office, sales-support and installation hours are summed. Open cases do not contain actual labor hours. Missing values are excluded.
Management action: Review high travel and office effort, distribute work by skills and validate entered hours.
Interpretation limits: Utilization, overtime and productivity rankings require available hours, leave, skills and case complexity. They cannot be derived from these records alone.
REPORT 06
Equipment availability, downtime and intervals
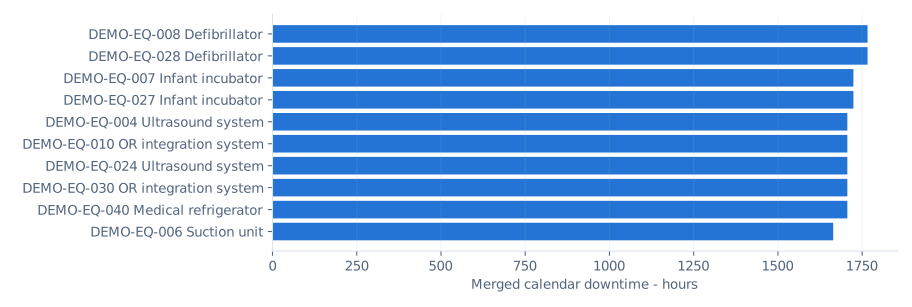
Calculate fleet availability from observation windows and merged downtime.
| Asset | Generic equipment | Down h | Availability % |
|---|---|---|---|
| DEMO-EQ-008 | Defibrillator | 1,766.0 | 74.4 |
| DEMO-EQ-028 | Defibrillator | 1,766.0 | 74.4 |
| DEMO-EQ-007 | Infant incubator | 1,724.0 | 75.0 |
| DEMO-EQ-027 | Infant incubator | 1,724.0 | 75.0 |
| DEMO-EQ-004 | Ultrasound system | 1,706.0 | 75.2 |
| DEMO-EQ-010 | OR integration system | 1,706.0 | 75.2 |
| DEMO-EQ-024 | Ultrasound system | 1,706.0 | 75.2 |
| DEMO-EQ-030 | OR integration system | 1,706.0 | 75.2 |
| DEMO-EQ-040 | Medical refrigerator | 1,706.0 | 75.2 |
| DEMO-EQ-006 | Suction unit | 1,664.0 | 75.8 |
| DEMO-EQ-026 | Suction unit | 1,664.0 | 75.8 |
| DEMO-EQ-003 | Ventilator | 1,643.0 | 76.1 |
| DEMO-EQ-023 | Ventilator | 1,643.0 | 76.1 |
| DEMO-EQ-020 | Medical refrigerator | 1,610.0 | 76.6 |
| DEMO-EQ-005 | Anesthesia workstation | 1,604.0 | 75.4 |
| DEMO-EQ-025 | Anesthesia workstation | 1,604.0 | 75.4 |
| DEMO-EQ-002 | Infusion pump | 1,580.0 | 77.1 |
| DEMO-EQ-022 | Infusion pump | 1,580.0 | 77.1 |
| DEMO-EQ-016 | Operating table | 1,568.0 | 77.2 |
| DEMO-EQ-037 | Washer-disinfector | 1,532.0 | 76.5 |
| DEMO-EQ-036 | Operating table | 1,520.0 | 77.9 |
| DEMO-EQ-015 | Operating light | 1,508.0 | 78.1 |
| DEMO-EQ-018 | Laboratory centrifuge | 1,478.0 | 78.5 |
| DEMO-EQ-021 | Patient monitor | 1,478.0 | 77.4 |
| DEMO-EQ-035 | Operating light | 1,460.0 | 78.8 |
| DEMO-EQ-001 | Patient monitor | 1,439.0 | 78.0 |
| DEMO-EQ-012 | Insufflator | 1,436.0 | 79.2 |
| DEMO-EQ-032 | Insufflator | 1,436.0 | 79.2 |
| DEMO-EQ-014 | Electrosurgical unit | 1,418.0 | 79.4 |
| DEMO-EQ-034 | Electrosurgical unit | 1,370.0 | 80.1 |
| DEMO-EQ-013 | ECG recorder | 1,355.0 | 79.2 |
| DEMO-EQ-011 | Endoscopy imaging system | 1,343.0 | 80.5 |
| DEMO-EQ-031 | Endoscopy imaging system | 1,343.0 | 80.5 |
| DEMO-EQ-038 | Laboratory centrifuge | 1,286.0 | 81.3 |
| DEMO-EQ-033 | ECG recorder | 1,283.0 | 80.3 |
| DEMO-EQ-017 | Washer-disinfector | 1,276.0 | 80.5 |
Calculation basis: Availability = (observed calendar hours - merged down hours) / observed calendar hours. Each asset has its own window; overlap is counted once. 960 consecutive reported-time intervals measure time between all work-order types.
Management action: Review the highest downtime assets and verify log completeness before replacement discussions.
Interpretation limits: Calendar uptime assumes operation outside recorded downtime. It is not live telemetry, shift-based availability or MTBF. Four incomplete logs are excluded from fleet availability.
REPORT 07
Response and SLA compliance
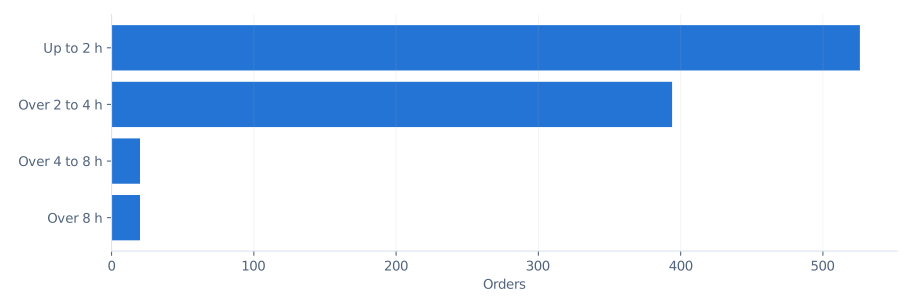
Separate first response from on-site arrival and eventual closure.
| Response band | Requests |
|---|---|
| Up to 2 hours | 526 |
| Over 2 to 4 hours | 394 |
| Over 4 to 8 hours | 20 |
| Over 8 hours | 20 |
Calculation basis: SLA: 920 passing requests / 1,000 eligible. Each request has its own assumed target; 40 unanswered overdue requests count as failures and are excluded from the mean response. Arrival excludes missing on-site events and remote cases.
Management action: Review the critical delayed-response scenarios and the missing-response population separately.
Interpretation limits: An average can hide outliers. Response time is not arrival, repair turnaround, closure duration or a clinical guarantee.
REPORT 08
Closure plans and backlog aging
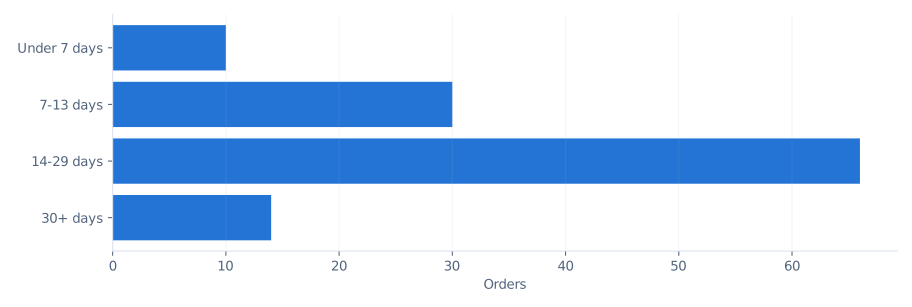
Track delayed closure and distinguish open dependencies.
| Age at snapshot | Open orders |
|---|---|
| Under 7 days | 10 |
| 7-13 days | 30 |
| 14-29 days | 66 |
| 30+ days | 14 |
Calculation basis: Aging = snapshot minus reported time for open orders. Closure lateness = completion after expectedCloseAt. Calendar duration and actual effort are separate.
Management action: Assign owners for replacement-part, site-readiness and customer-access dependencies; update expected closure with evidence.
Interpretation limits: Dependency labels are scenario sidecar assumptions. There is no native dependency workflow, pause clock or automatic customer-delay exclusion.
REPORT 09
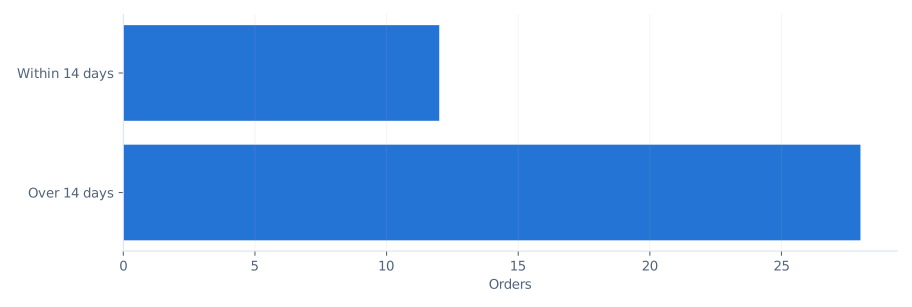
Repair-center turnaround and 14-day review
Assess the depot timeline from receipt to return.
| Turnaround measure | Hours |
|---|---|
| Minimum | 234.0 |
| Median | 450.0 |
| Mean | 450.0 |
| Maximum | 666.0 |
Calculation basis: Receipt-to-return time uses 40 completed repair-center events. The 14-day threshold is a configurable evaluation assumption, not a regulatory requirement.
Management action: Investigate the assumed parts wait before assessing repair-center stock or capacity options.
Interpretation limits: No bench-stage timestamps, technician queue, supplier turnaround or RMA workflow is captured; total turnaround does not isolate those causes.
REPORT 10
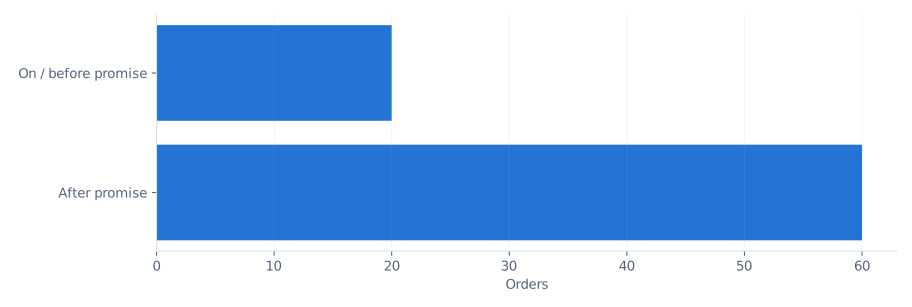
Delivery lead time and promise adherence
Review requested-to-receipt and dispatch-to-receipt performance.
| Outcome | Deliveries |
|---|---|
| On / before promise | 20 |
| After promise | 60 |
Calculation basis: Lead time = delivered minus requested; transit = delivered minus dispatched. Promise comparison uses the entered promised delivery timestamp.
Management action: Review the 60 late deliveries and identify assumptions about dispatch and transit separately.
Interpretation limits: One delivery set is supported per order. There is no split-shipment, carrier tracking, proof-of-delivery attachment or invoice-readiness control.
REPORT 11
Preventive maintenance and due register
Combine completed planned visits with the next-due asset register.
| PM measure | Result |
|---|---|
| Completed PM visits | 120 |
| PM-only contract visits | 40 |
| On-time planned PM scenario | 40 |
| Late planned PM scenario | 40 |
| Assets with next-due date | 40 |
Calculation basis: PM visits are work orders; the due register is a separate asset field. Scenario labels intentionally include on-time and delayed completion.
Management action: Confirm a maintenance plan per asset and reconcile the next-due date after each accepted visit.
Interpretation limits: Fleet PM compliance needs a planned schedule with expected visits and valid completion/deferral records. The current next-due register alone is not that denominator.
REPORT 12
Installation, commissioning and sales support
Separate installation fees and support effort from general service charges.
| Activity category | Recorded h | Internal labor cost SAR |
|---|---|---|
| Field | 2,081.0 | 249,855.00 |
| Travel | 1,827.5 | 220,875.00 |
| Office | 434.5 | 52,057.50 |
| Sales support | 80.0 | 9,600.00 |
| Installation | 240.0 | 30,000.00 |
Calculation basis: Forty completed commissioning assumptions and forty open readiness assumptions. Installation fee is an additional entered revenue line.
Management action: Validate site readiness before dispatch, capture acceptance evidence and review sales-support effort.
Interpretation limits: No signed acceptance, site checklist workflow, milestone billing or capital-project accounting is implemented.
REPORT 13
Warranty and coverage economics
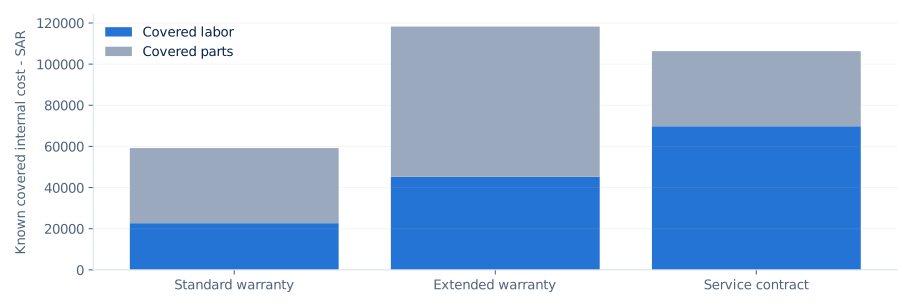
Examine internal covered labor and parts even where the customer charge is zero.
| Coverage | Dated jobs | Covered labor SAR | Covered parts SAR | Revenue SAR |
|---|---|---|---|---|
| Standard warranty | 40 | 22,691.25 | 36,500.00 | 3,975.00 |
| Extended warranty | 120 | 45,262.50 | 73,000.00 | 174,636.25 |
| Service contract | 120 | 69,798.75 | 36,500.00 | 68,500.00 |
| Chargeable | 560 | 0.00 | 0.00 | 1,635,218.75 |
| Not assessed | 40 | 0.00 | 0.00 | 0.00 |
Calculation basis: Coverage includes standard, extended labor-only, parts-only and combined variants, comprehensive/PM/labor service contracts, chargeable work and not-assessed cases. Covered internal costs remain costs.
Management action: Review covered expense by service type and validate the applicable agreement before customer billing.
Interpretation limits: Coverage is user entered, not insurer/manufacturer approval. No automatic premium allocation, reserve calculation or contract accrual is performed. Entered fee revenue is an assumption.
REPORT 14
Contract coverage and renewal exposure
Review contract state, expiry and the four catalog coverage options.
| Coverage | Catalog records | Annual catalog value SAR |
|---|---|---|
| Comprehensive | 10 | 1,245,000.00 |
| Preventive maintenance | 10 | 1,395,000.00 |
| Labor only | 10 | 1,545,000.00 |
| On demand | 10 | 1,695,000.00 |
Calculation basis: Active is a stored status; expiry is checked separately. Annual catalog values describe the register and are not recognized revenue or job contribution.
Management action: Resolve active-but-expired entries, confirm owners and build a renewal calendar.
Interpretation limits: The data has no contract-to-asset entitlement matrix, renewals pipeline, premium allocation, tax treatment or signed agreement files.
REPORT 15
Stock availability, valuation and reorder review
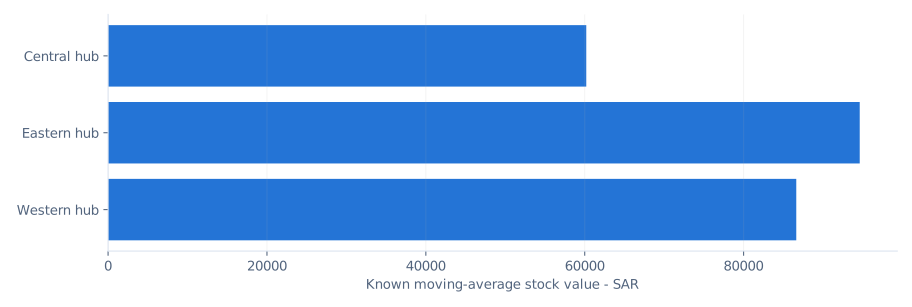
Reconstruct on-hand and available units by part and service hub.
| Location | On hand | Reserved | Available | Stock value SAR |
|---|---|---|---|---|
| Central hub | 136 | 3 | 133 | 60,195.18 |
| Eastern hub | 207 | 3 | 204 | 94,618.42 |
| Western hub | 185 | 4 | 181 | 86,630.45 |
Calculation basis: On hand = opening balance + posted net movements; available = on hand - active reservations. Incoming costs determine location moving averages. All 40 positive/zero positions have entered opening valuation.
Management action: Review 3 expired catalog references at the snapshot and 4 references at/below aggregate reorder point. Suggested top-up uses reorder point + 1 minus available.
Interpretation limits: Reorder prompts are not forecasts or purchase orders. Expiry is catalog-level; batch/serial tracking, quarantine and FEFO picking remain gaps.
REPORT 16
Stock movement and work-order cost reconciliation
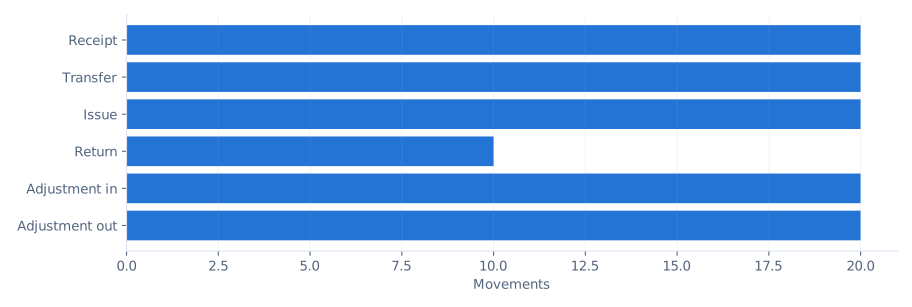
Link physical stock changes to explicit work-order parts costing.
| Movement | Count |
|---|---|
| Receipt | 20 |
| Transfer | 20 |
| Issue | 20 |
| Return | 10 |
| Adjustment in | 20 |
| Adjustment out | 20 |
Calculation basis: The fixture contains receipts, transfers, issues, original-cost returns and count adjustments. Ten reservations remain active, twenty are fulfilled and ten released. Twenty open jobs use ledger parts costing; none has a financial date.
Management action: Confirm ledger costing before replacing a manual parts cost, reconcile returned quantities and review adjustment reasons.
Interpretation limits: Customer charges are not automatically changed. Posted entries are immutable; use correcting movements. Browser actor labels are not authenticated; the self-hosted server audits the authenticated actor and revision.
REPORT 17
Price-list versions and quote variance
Compare stored estimates with recorded job outcomes.
| Catalog category | Version count |
|---|---|
| Labor | 3 |
| Parts | 3 |
| Travel | 3 |
| Office | 3 |
| Sales support | 3 |
| Installation | 3 |
| Other | 3 |
| Extended warranty | 3 |
Calculation basis: Quoted cost/revenue fields contain explicit scenario assumptions. Price rows include validity periods. The scenario generator does not automatically bind every quote to a price-list line.
Management action: Review overrun by job before amending a price list; preserve a pricing snapshot for actual commercial quotes.
Interpretation limits: No tax, discount approval, currency conversion, supplier purchasing or formal quotation workflow is implied.
REPORT 18
Recurring service and technical evidence
Review repeated corrective work without treating repetition as proof of repair failure.
| Technical report example | File |
|---|---|
| Standard warranty | technical-report-warranty.html |
| Repair center | technical-report-repair.html |
| Installation | technical-report-installation.html |
| Recurring event | technical-report-repeat.html |
| Open order | technical-report-open.html |
Calculation basis: Repeat alerts use linked corrective orders in the 30 days before the fixed snapshot. Technical narratives and suspected causes are fictional. First-visit fix uses explicit Yes/No outcomes on completed cases.
Management action: Open the original technical report, review the fault and evidence, then assign an investigation or corrective action.
Interpretation limits: No authenticated engineer signature, customer acceptance, safety release or root-cause workflow is captured. Local report review metadata is not proof of approval.
REPORT 19
Data quality, test coverage and release gaps
Show which records support each metric and what additional modules require.
| Capability | Current coverage / remaining gap |
|---|---|
| Service and reliability | Work orders, events, downtime and costs supported; no clinical validation or live telemetry |
| Stock operations | Receipts, issues, returns, transfers, reservations, counts and cost linkage; no POs, batch/serial, quarantine or automated replenishment |
| Accounting / commercial | Operational contribution; no invoices, cash, receivables, tax ledger or recognized contract accounting |
| Integration / Apple | SAP staging only; live SAP/Salesforce and App Store release remain incomplete |
| Security / deployment | Self-hosted roles, revisions and encrypted storage; production security and organization isolation need acceptance |
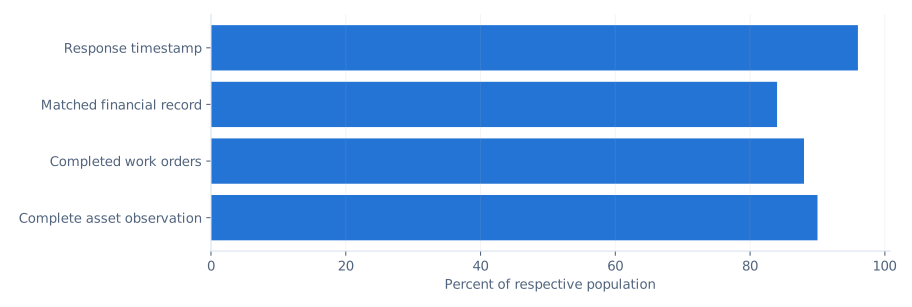
Calculation basis: All 1,000 jobs validate against the app schema and linked timelines. Thirteen invalid fixtures are rejected. Financial totals, downtime union and regional/customer/engineer totals reconcile independently. Inventory tests cover valuation, protected reservations, return caps, overdraw, expiry, locked orders and failed-save atomicity.
Management action: Use this pack for evaluation in a test workspace. Replace assumptions with verified records and agree acceptance criteria before operational use.
Interpretation limits: A passing synthetic suite is not security, clinical, accounting or legal certification. Native iOS source remains uncompiled and unsigned.
Supporting files
Expected results / rejection tests · Full numeric report data · Coverage matrix · Stock movements · Reservations